Demo Box v1.2

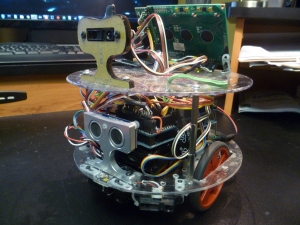
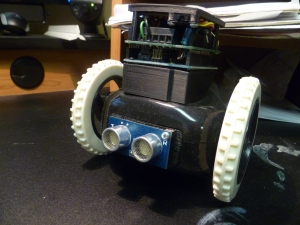
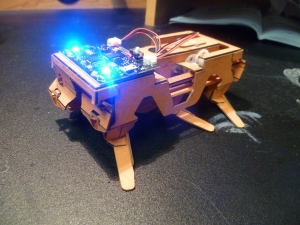
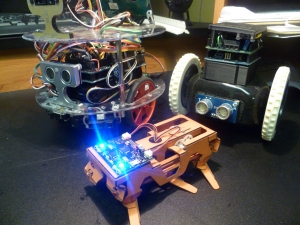
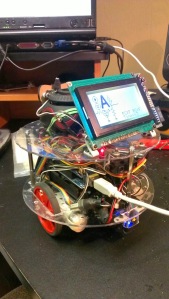
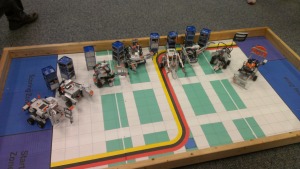
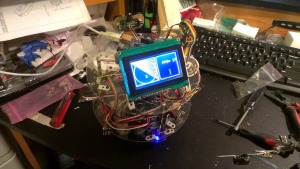
When I was preparing for my first set of interviews with Apple (January 2015) I decided to throw together a box which would combine various hardware/software projects that I had worked on in the past. Putting together this box of “demos” was a way to remind myself about some of the various projects I’ve worked over the past  few years. Also, I thought it might make a cool visual aid if the opportunity arose to show it off during an interview.

Just recently I dusted the thing off and decided to take some pictures and the above video, so that I could document what is actually being demonstrated in this box.

Robotics Specialization, University of Pennsylvania, Coursera

I mentioned in my last post that I was registered for the Coursera Robotics Specialization offered by the University of Pennsylvania. Now that several months have past I have finally completed all six courses in the Specialization.

The specialization was great overall, but did take considerable time over about 6 months. Each course was around 4-5 weeks long,  and took on average something about 10-12 hours a work per week (including all the lecture videos, quizzes and programming assignments). Some of the material was definitely a review from classes I took in college, however, some of the material was brand new to me.

The final class was a capstone project that involved pulling together concepts from the previous 5 classes to build a real physical robot. Since I love building real robots, I was quite thrilled. I was curious how the grading system would handle students building their own robots at home, and was surprised by the rather clever system Coursera uses. Each student submits a video of their robot doing whatever the assignment requires, and then this video is graded by at least three other students in the class who have also submitted a video for review. Below I’ll are the videos I submitted for grades in the capstone class:

This video was used to demonstrate that I built my robot properly, including wiring, soldering, power supplies, motor controller, etc.

This video demonstrates that I had properly calibrated and configured the robot’s front facing camera, and written a controller that allow the robot to follow an April Tag.

This video demonstrates (using a simulator) that I had properly written an Extended Kalman Filter (EKF) for State Estimation. (The outline robot represents the estimated state and the blue robot represents the actual state).

This was the final video for the final week of the capstone class. In this video we see that the robot plans a path from its initial position to a goal position, maneuvers through a field that includes obstacles and is able to do so because it has an accurate estimate of its state (position) even when it cannot see the April Tags (which are used for localization).


The certificates I earned for the specialization and individual classes can be seen here.

Keeping Sharp

So, I know I haven’t kept up with posting here, even as I have been working on a variety of projects. Recently, in order to keep my academic skills sharp I’ve decided to check out what Coursera has to offer. I’ve just completed the original course on Machine Learning taught by Andrew Ng of Standford, so I wanted to share that here.

https://www.coursera.org/account/accomplishments/records/BBJ5ECCRMC9P

I’m also registered for the entire five course Robotics specialization offered by Penn. I’ll let you know how it goes!

Hello again my old friends…

So much has happened since my last post (moving to Boston, working full-time on the firmware for thousands of Amazon robots, getting married, etc.), I really don’t know where to begin.

I’ve got a pile of new projects (plus some old ones I never got time to tell you about) that I do plan on posting to here in the very near future. In the mean time I’ll just leave you with a few pictures to tide you over till I find some time to write more.

Oscar 2.0

Clocky (he's not a clock, he's a robot!)

My Dash

The new petsIMAG1165 IMAG0200 IMAG0457

Wireless Transmission of Sensor Data

As a brief experiment into rapid logging of sensor data and equally fast transmission of that data to a PC I have written a couple sketches for the Arduino and Processing to do just this. The goal is to read from an analog sensor on the Arduino (which will eventually consist of some sort of biometric sensor like a PPG sensor) at a rate of close to 1kHz, log the data to a data logger, and transmit the data wirelessly to a computer running Processing. The simple Arduino sketch attempts to use its built-in timers to read the sensor at 1kHz as well as log and transmit the data.

/*
 This example shows how to read and write data to and from an SD card file
 The circuit:
 * SD card attached to SPI bus as follows:
 ** MOSI - pin 11
 ** MISO - pin 12
 ** CLK - pin 13
 ** CS - pin 10
*/

#include <SD.h>
#define CS 10
#define BUTTON 15
File myFile;
int PPG = 0;

void setup()
{
  Serial.begin(57600);
  Serial.println("Initializing SD card...");
  // On the Ethernet Shield, CS is pin 4. It's set as an output by default.
  // Note that even if it's not used as the CS pin, the hardware SS pin
  // (10 on most Arduino boards, 53 on the Mega) must be left as an output
  // or the SD library functions will not work.
   pinMode(CS, OUTPUT);
   analogReference(EXTERNAL);

//  if (!SD.begin(CS)) {
//    Serial.println("initialization failed!");
//    return;
//  }
//  Serial.println("initialization done.");

  // open the file. note that only one file can be open at a time,
  // so you have to close this one before opening another.
  //myFile = SD.open("logTest.txt", FILE_WRITE);
  int analogVal = 0;
  // if the file opened okay, write to it:
  //if (myFile) {
    //Serial.println("Writing to logTest.txt...");
    //**********//

    long period = micros();
    long startTime = millis();
    long number = 0;
    // A LED on pin 2 indicates when the system is running
    pinMode(2, OUTPUT);
    digitalWrite(2, HIGH);
    Serial.println("$$$");
    // While the button is not pressed (1) read the sensor
    while(digitalRead(BUTTON) == 1) {
      int i = 0;
      while(i < 1000) {
        if((micros() - period) >= 830) {
          analogVal = analogRead(PPG);
          period = micros();
          //myFile.println(analogVal);
          Serial.println(number);
          i++;
          number++;
        }
      }
    }
    long endTime = millis();
    digitalWrite(2, LOW);

    //**********//
    //myFile.close();  // close the file:
    //Serial.println("\ndone writing to logTest.txt");
    Serial.print("It took ");
    Serial.print(endTime - startTime);
    Serial.print(" mSec to write ");
    Serial.print(number);
    Serial.println(" integers to the SD card%");
  //} else {
    // if the file didn't open, print an error:
  //  Serial.println("error opening logTest.txt");
  //}
}

void loop()
{
	// nothing happens after setup
}

The Processing sketch is written to use the serial library to connect to an Xbee through a virtual serial port. It looks for a transmission starting character, in the Arduino sketch this is “$$$” and then logs all the remaining data to a file named “log.txt” until it sees the end of transmission character which has been arbitrary selected as “%” for this test.

import processing.serial.*;

Serial myPort;

PrintWriter out_f;

void setup() {
  size(200, 200);
  println(Serial.list());
  String portName = Serial.list()[1];
  myPort = new Serial(this, portName, 57600);
  out_f = createWriter("log.txt");
}

void draw()
{
  while ( myPort.available() > 0) {  // If data is available,
    char c = char(myPort.read());
    if (c == '\r' || c == '$') {
      int h = hour();
      int m = minute();
      int s = second();
      int mill = millis();
      println("\t"+h+":"+m+":"+s+"."+mill%1000);
      out_f.print("\t"+h+":"+m+":"+s+"."+mill%1000);
      out_f.flush();
    }
    else if(c == '%') {
      out_f.close();
    }
    else {
      print(c);
      out_f.print(c);
      out_f.flush();
    }
  }
}

In addition to logging the transmitted sensor data, the Processing sketch also adds a time-stamp to the data as well which consists of the hour, minute, second, and thousands of a second when each data-point was received. Each character is written to the file separately and the time-stamp is only added when a new data-point is detected (as a newline character ‘\r’).

E-expo Research Competition

I just received an email this morning that my Decision Tree Generator project placed in the top five projects exhibited in the graduate student research competition this year! As one of I believe only two masters (as opposed to PhD students) in the competition, and from what I saw the only person with a single semester project in the competition I am very excited to have placed at all. We won’t find out our exact place or our awards until March 31st at the Speed School Engineer’s Ball. I’ll be sure to let you all know how  things turn out with the awards as soon as I know myself. As of right now I am still focused on setting up my system to be used for education and expansion as well as working on my projects in my other classes (Computational Cognitive Science, Computational Intelligence Methods for Data Analysis) as well as continuing my job search.

Kohonen’s Self Organizing Feature Map Demo

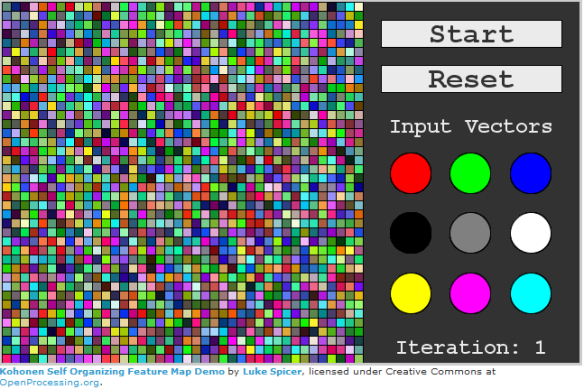
For the University of Louisville Electrical and Computer Engineering Class, ECE 613 “Computational Methods for Data Analysis” taught by Dr Zurada, we were instructed to find a demo of Kohnen Self Organizing Feature Maps (SOFM), or for extra credit to create one of our own. I read a brilliant tutorial about SOFM and updated the java version of their example demo to work with Processing. I also added a user interface which allows for the selection of the input vectors. Thanks AI Junkie for the tutorial and backend code. If anyone is interested in neural networks or SOFM please check out their tutorials. I have hosted the Processing sketch at OpenProcessing.org, but unfortunately WordPress does not allow the applet to be directly embedded in this blog.

Kohonen’s Self Organizing Feature Map Demo

Self Organizing Featur Map Demo

Preparing for E-Expo

Annually the J.B. Speed School of Engineering at the University of Louisville holds a day of competitions, tours, speakers, games and outreach known as E-Expo. The event is student run and organized with the following goals:

There are three main goals of the Engineering Expo that have changed little since the beginning of the event. E-Expo must foster a sense of competition among the Speed School engineering students as they seek to put their best work on display for the public and corporate representatives that attend the event. Another valuable objective is to provide a means for the students of the Speed School of Engineering to network with companies in order to establish contacts with the professional world in the form of informal interviews, co-ops or internships, or even lasting employment. The last requirement of a successful E-Expo is to promote the University of Louisville and the Speed School of Engineering to potential students, companies, faculty, and the general public.

This year I have decided to participate in the E-Expo by presenting the work I’ve been doing this semester with the Decision Tree Generator. The competition is judged based on the following criteria:

  • Relevance of the project/research to society and the scientific community
  • Exhibitor attitude and demeanor
  • Presentation skills
  • Ability to explain technical topics clearly
  • Poster organization and quality

The students don’t generally present posters, but rather they present a tri-fold, science fair style board with information about their project. I have attached my presentation here as a pdf for those who may be interested to see what I plan to present. The competition is an opportunity to show off the work I have been doing as well as a possibly to win a prize!

Formatting Data for the Decision Tree Generator

In my last post I explained a bit about what needs to be passed to the decision tree generator’s constructor function, but I didn’t go into detail about how to get the numbers into the formats specified. Luckily it’s very easy! I have included a function in the decision tree generator sketch which will take a properly formatted text file and and automatically turn it into the column array of integers that you need. Also in the example sketch folder I have included some such text files as examples. Essentially you will need one text file each for the output array and for each of your attributes. The text file should be formatted to contain only the number 0 through however many levels that particular attribute or output can take on. Each number should be on its own line and the file should contain no punctuation. This may sound tedious to make, but Microsoft Excel, Matlab and many other free spreadsheet programs can save a column of numbers in just such a format by saving the file as a .txt or .csv. The text file just needs to be placed in the same folder as the Processing .pde file (the sketch itself) and it should be good to go. Now you should be ready to follow this example and make your decision tree! The example shows generically how to load the output, three attributes and then create their labels and variables. The variable and text file names can obviously re-named to anything you may want.

  //*****************
  // Load a text file with separate values (just an integer number) on each line
  // the text file is converted to an integer array which can be input to the decision tree generator

  int[] output = loadData("outputs.txt");
  int[] attribute0 = loadData("attribute0.txt");
  int[] attribute1 = loadData("attribute1.txt");
  int[] attribute2 = loadData("attribute2.txt");

  //******************
  // OUTPUT Information
  String[] output_labels = {"out_label1", "out_label2"};

  // INPUT #0 / Attribute 0
  int num_attribute0_levels = 3;   // 0 = level0, 1 = level1, 2 = level2
  String[] attribute0_labels = {"level0", "level1", "level2"};

  // INPUT #1 / Attribute 1
  int num_attribute1_levels = 2;   // 0 = false, 1 = true
  String[] attribute1_labels = {"false", "true"};

  // INPUT #2 / Attribute 2
  int num_attribute2_levels = 4;  // 0 = low, 1 = med, 2 = high
  String[] attribute2_labels = {"Low", "Med", "High"};

  // INPUT Information
  int[][] input_attributes = {attribute0, attribute1, attribute2};
  String[] attribute_labels = {"Attribute_0", "Attribute_1", "Attribute_2"};
  String[][] attribute_level_labels = {attribute1_labels, attribute2_labels, attribute3_labels};
  Decision_Tree tree;
  int leave_out = 2;
  int[] node = {1, 1};
  float screen_width = width;